Reporting & Dashboards
Understand Your Data
One big reason we collect data is to eventually tell a story with it, but it can be hard to make sense of trends and performance on cluttered spreadsheets alone. Data is most effective when the content is visual and the trends are benchmarked, clear and comparative.
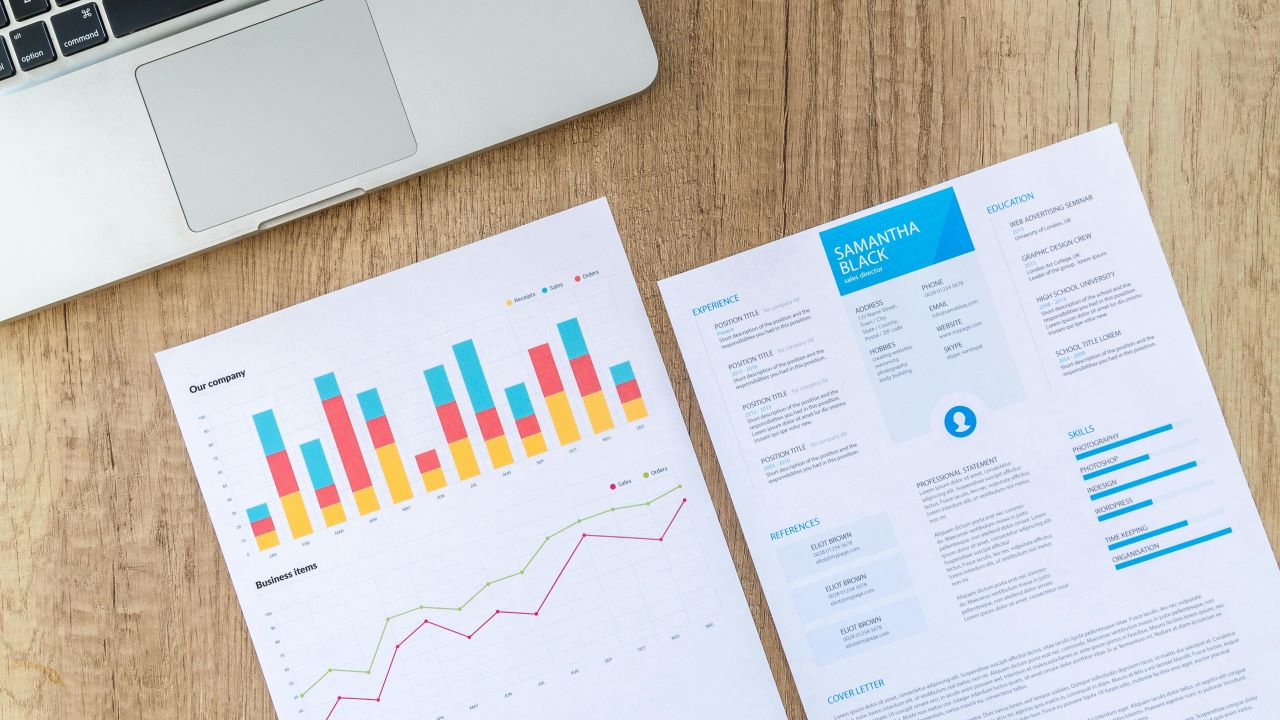
Once the data architecture is optimized for your unique scenario, we work with you to build systems that display your data in real time via visual report elements. Your team can identify trends quickly so you can make informed, timely decisions that elevate your business practices. Seeing months of work beautifully summarized will leave your team with a sense of pride in their accomplishments.
Remove barriers and make your data more accessible than ever
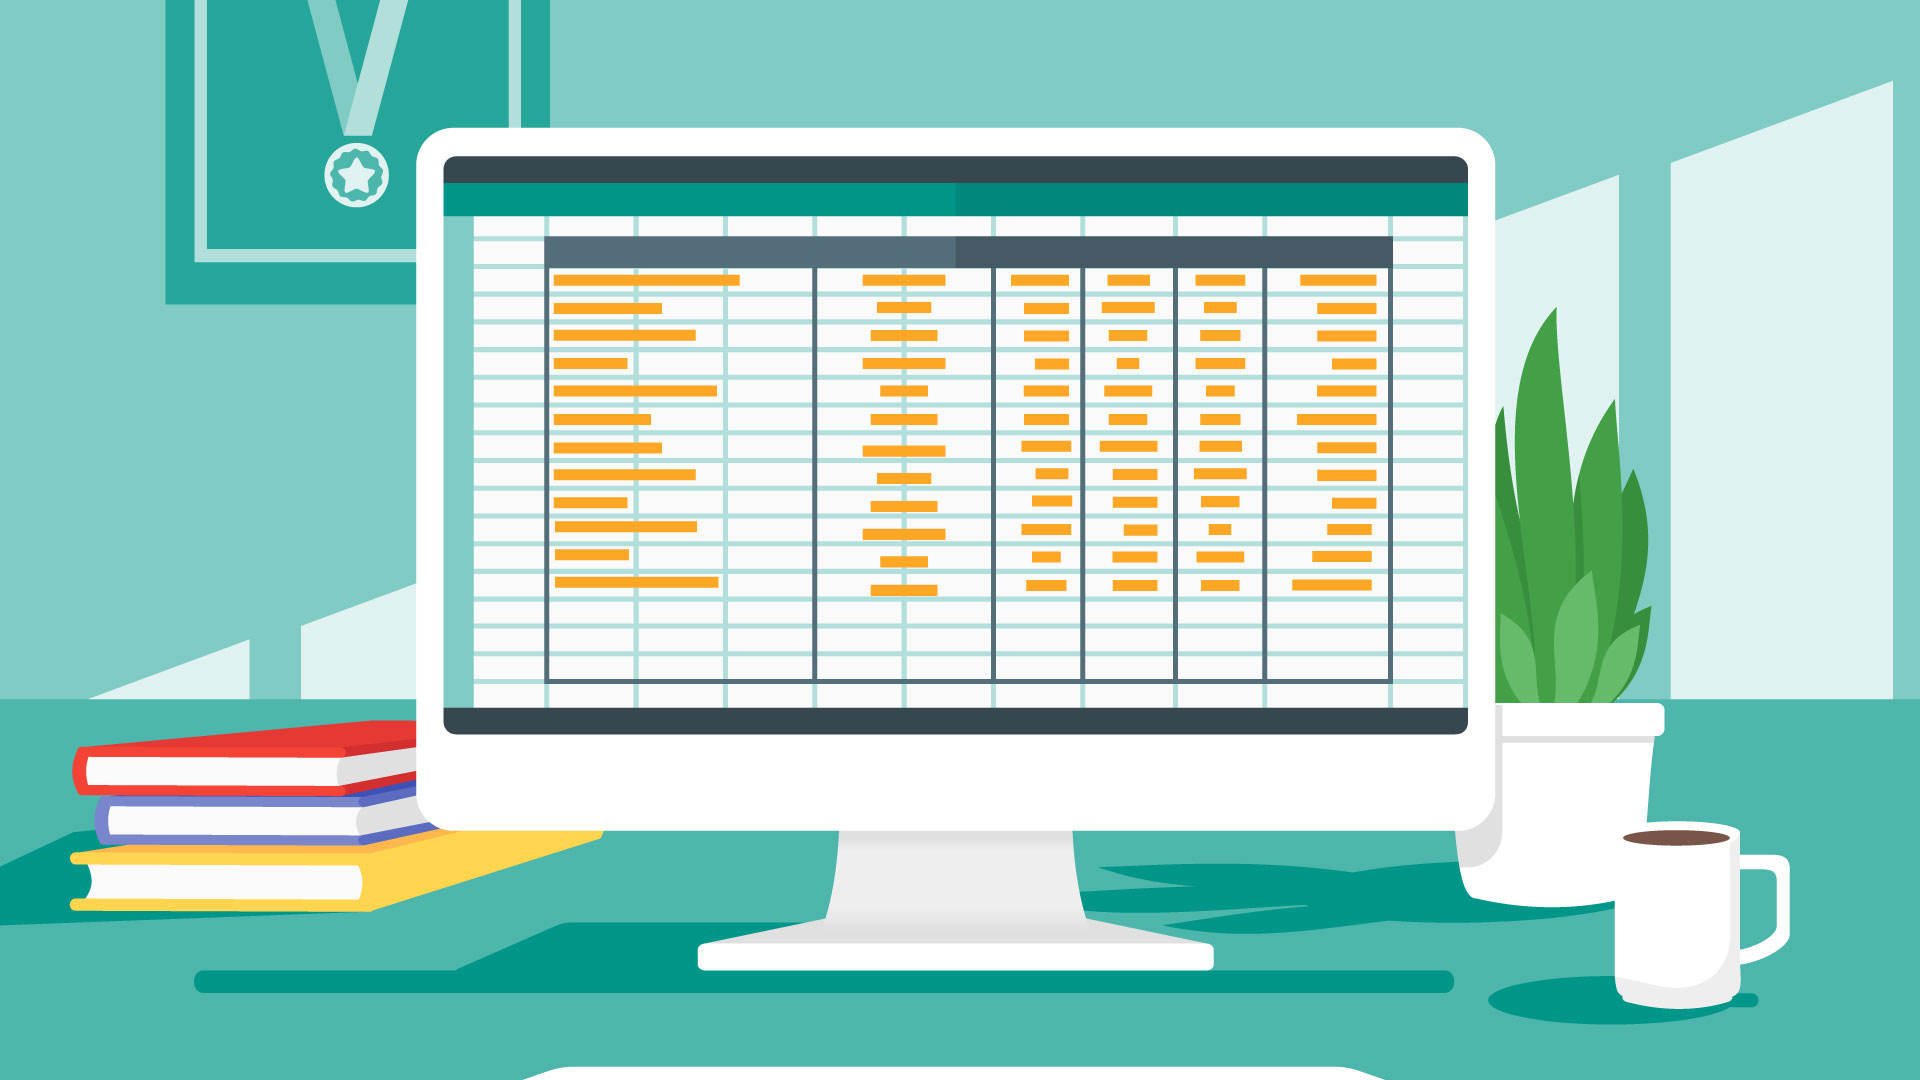
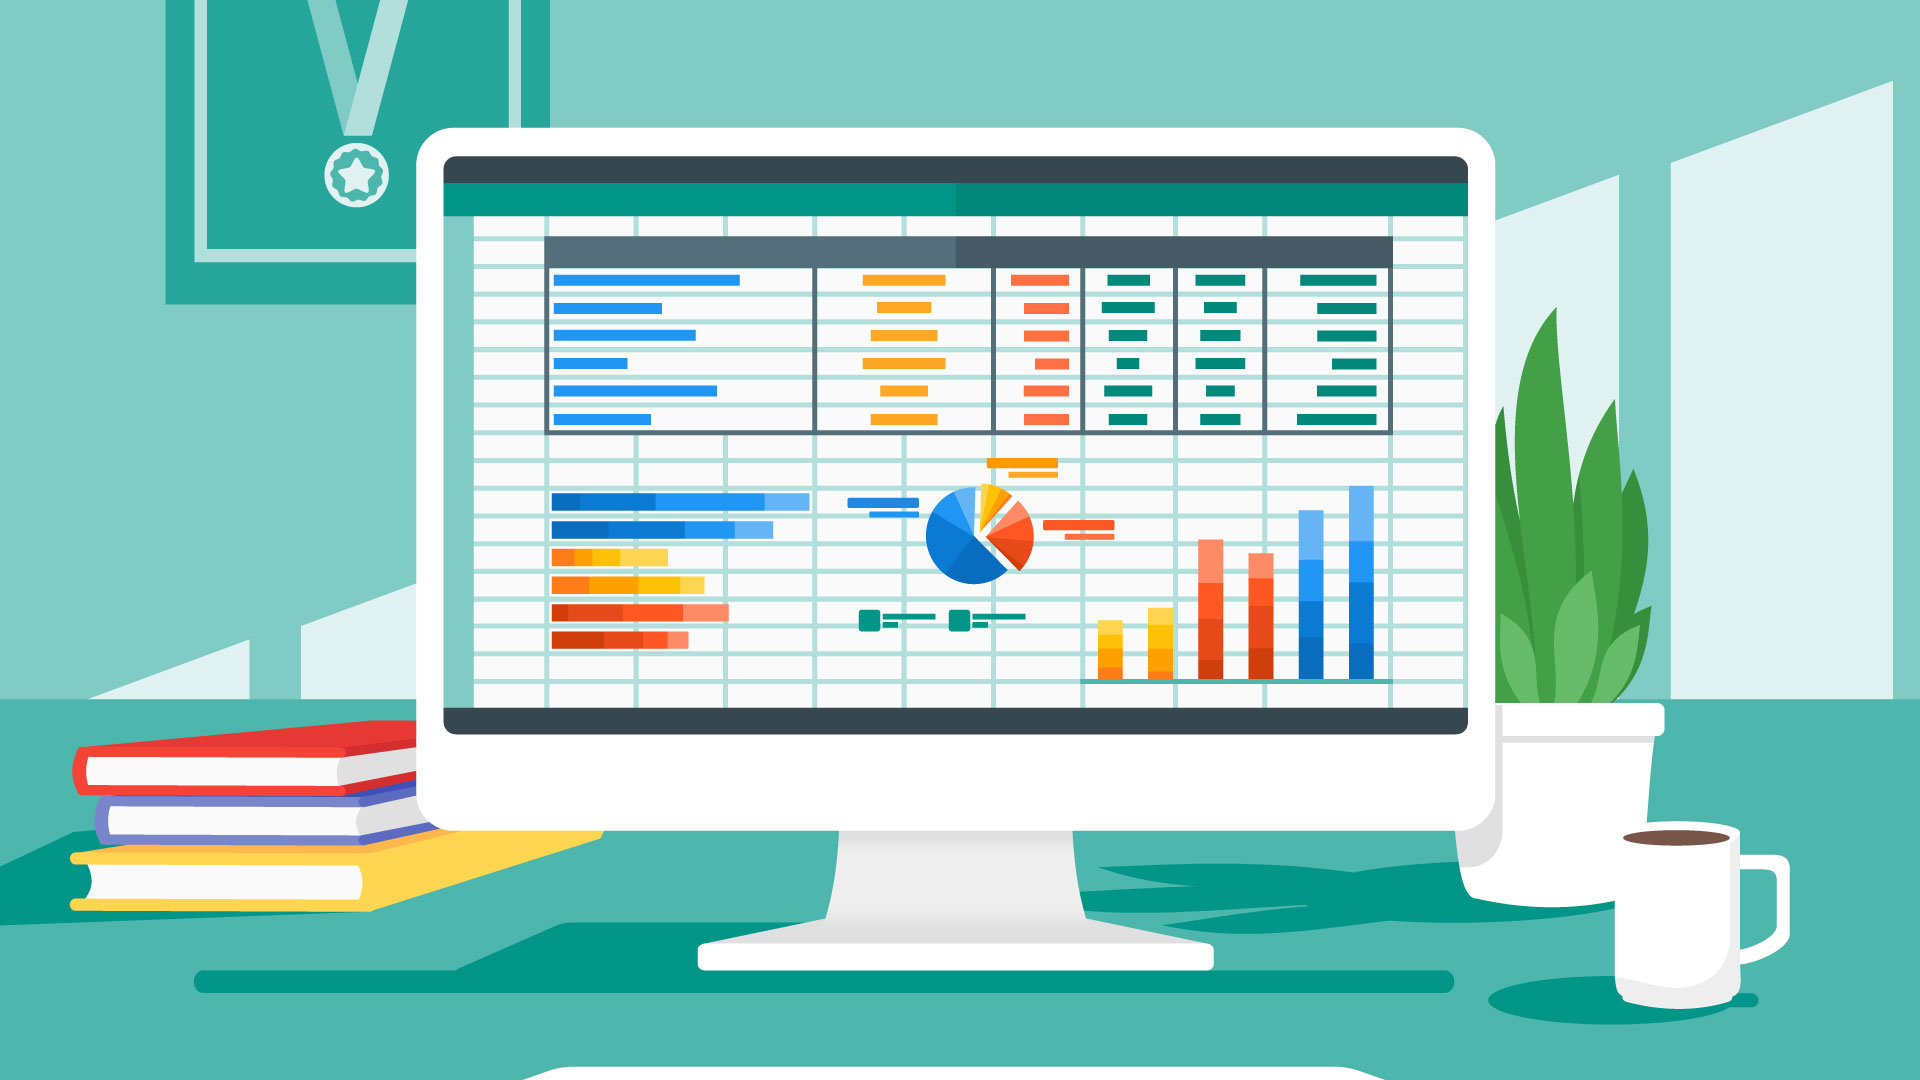
Have your data work for you with visual reports that set your business up for success
Day-to-day dashboards show the data your staff needs to interact with in real-time. Data updates automatically and condenses multiple sources of information into one accessible location. Key performance dashboards make it easy to track the health of your business operations.
Holistic dashboards connect everything together for the view from 30,000, stretching from years back to present day operations. Your data will be ready for your Executives, your Board of Directors, or the community you serve through click-to-download summaries in the format of your choosing.
Reports provide a detailed snapshot of your dataset.
Types of Dashboards
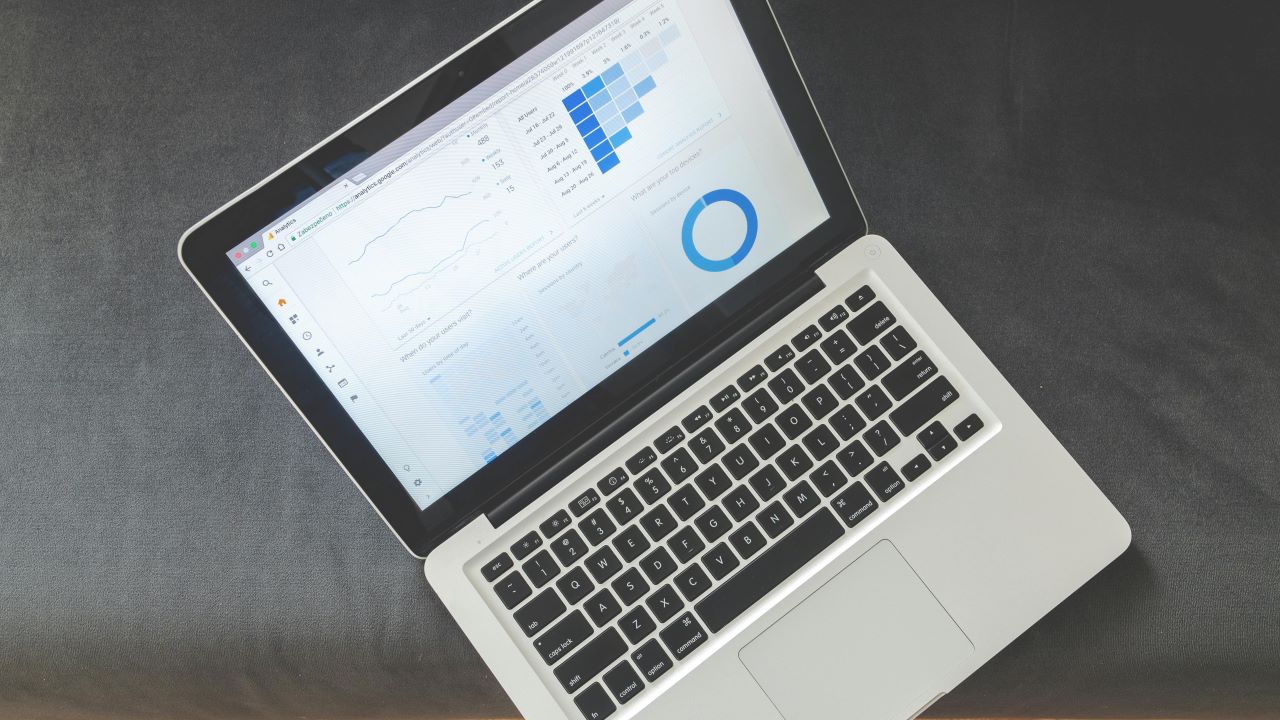
Day-to-Day Dashboards
- Real-time progress towards goals
- Upcoming tasks
- Recent record links
- Bulk modify from list views
- Single location
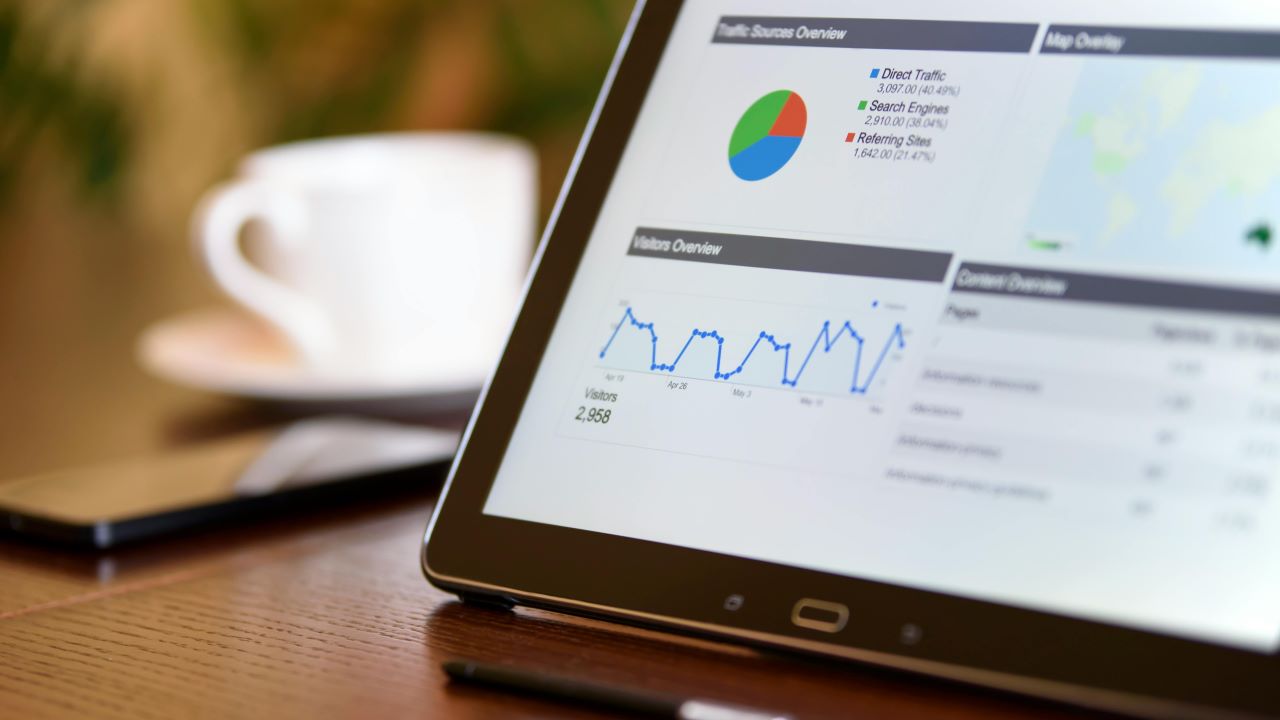
Holistic Dashboards
- Broad view of data
- Quantitative and qualitative analyses
- Identify trends quickly
- KPIs
- Visually appealing infographics
Reports
- Information snapshot
- Detailed representation of your dataset